The "Talairach brain atlas" in BrainVoyager consists of two parts: The TalairachBrain.vmr file and the Brodman.voi file. These files can be used to visualize Brodman areas as they were defined for the Talairach brain (Talairach & Tournaux, 1988) and to compare regions of subjects with respect to the Brodman areas. The demarcated areas are based on the "Talairach demon" (<web link>), which is a digitized version of the Talairach atlas and which has been transferred into BrainVoyager VOI files by Matthias Ruf, Mannheim. Using the Brodman.voi file you may ask questions like the following: "What is the signal time course of subject N in experiment A within Brodman area X ?". Note, however, that the defined areal boundaries should be used only as a rough guideline for determining the location of activated regions: There is substantial variation of histologically defined areas between subjects. Since cytoarchitectonically defined Brodman areas are not available in vivo, we advise to use the provided information with care.
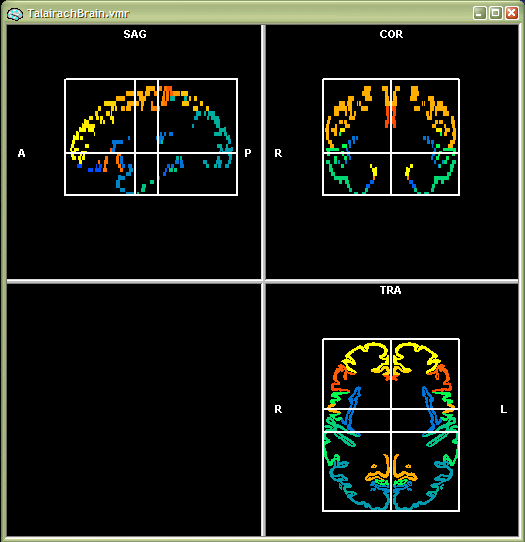
The TalairachBrain.vmr file is located in the same folder as your BrainVoyager executable file. It can be loaded as any VMR project by using the Open... item in the File menu (or the Open icon). The TalairachBrain.vmr file is also loaded automatically when using the "glass brain" visualization tool. The snapshot below shows the loaded file in the 3D VMR window. The "partial Talairach grid" has been superimposed by checking the Display partial grid option in the Talairach tab of the 3D Volume Tools dialog. As you can see, the best quality is obtained in the transversal view window. This is because the Talairach brain has been defined with a slice thickness of 4 mm.
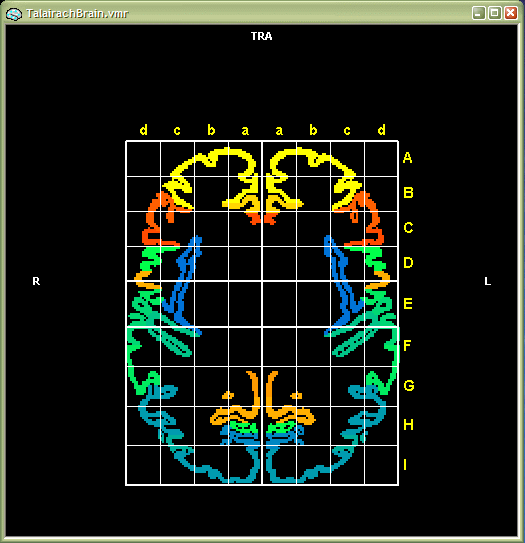
The snapshot below shows an enlarged version of the TRA view, which can be obtained by pressing the "CTRL-T" key combination three times. The "full Talairach grid" has been superimposed now by checking the Display full grid option in the Talairach tab of the 3D Volume Tools dialog. The color-coded regions allow an easy look-up of Brodman areas by looking in the Talairach and Tournaux atlas (it is planned for a future release to label the areas automatically when moving with the mouse over the colored regions).
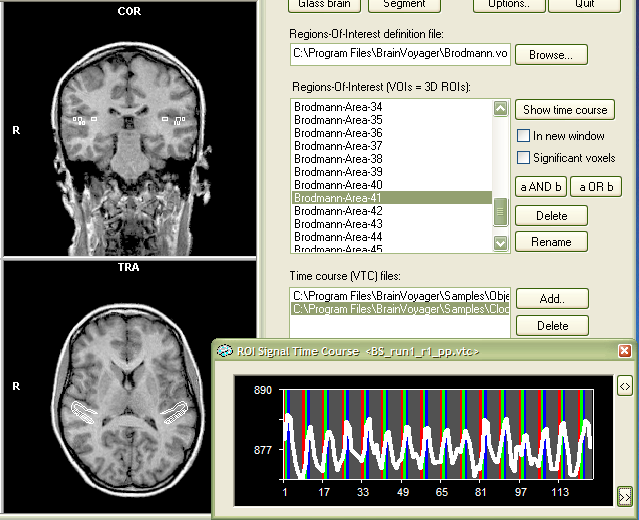
The Brodman.voi file provides the link of the Brodman areas to the anatomical and functional data of your studies. After loading the VOI file, you can select a Brodman region and visualize that region together with an associated time course from any experiment. The VOI file can be loaded using the ROI Analysis tool. Load any VMR data set in Talairach space. For the example used here, we load the file "BS_TAL.vmr", which is located in the "Samples\ClockTask" folder. Then invoke the Region-Of-Interest Analysis dialog by clicking the Region-Of-Interest analysis.. item in the Analysis menu (or simply press the "R" key). Click the Browse... button next to the Region-Of-Interest definition file text box. Navigate to your BrainVoyager folder (i.e. "C:\Program Files\BrainVoyager), select the file "Brodmann.voi" and click Open.
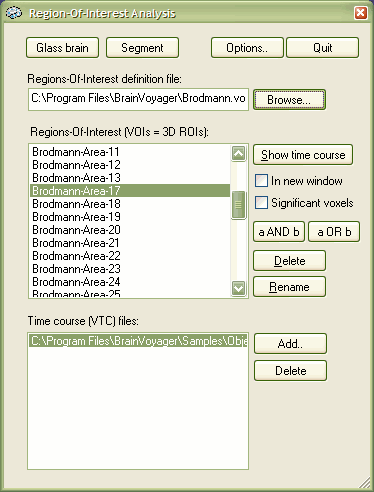
The Regions-Of-Interest list
box is now filled with names referring to the "VOIs" for the
Brodmann areas (VOI = volume-of-interest).
You can now simply select a Brodmann area by clicking on its name. You
can also select multiple areas by holding down the CTRL key while selecting
names with the mouse. To show the selected Brodmann region(s) with an
associated time course, you must also select a VTC file. The Time
course (VTC) files: list box shows all VTC files added previously
to the Brodmann.voi file. You can add VTC files to this list by clicking
the Add... button. After having
selected a VTC file, click the Show time
course button. The selected VOI will be highlighed in the loaded
VMR data set and a time course window will appear showing the associated
time course from the specified VTC file.
As an example, consider the snapshot below. Here "Brodman-Area-41",
the primary auditory cortex, has been selected in the Region-Of-Interest
list box. The 3D cluster corresponding to the selected VOI is shown outlined
in the 3D VMR View window (white lines on left side), which overlaps indeed
the cortex within the Heschl gyrus of the subject's brain to some extent.
In addition, a VTC file from a paradigm with auditory stimulation ("BS_run1_r1_pp.vtc"
from the "ClockTask" sample directory) was added to the Time course (VTC) files: list box and
selected with a mouse click. The time course from that region shows event-related
responses to the auditory stimulation.
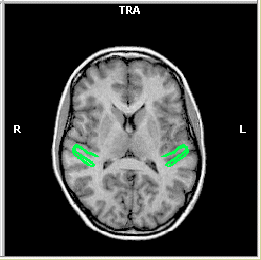
Besides in outline mode, a VOI can also be shown "filled", i.e. all voxels belonging to a cluster are set to a certain color value. You can change the respective settings in the ROI Analysis Options dialog, which can be invoked by clicking the Options... button in the Region-Of-Interest Analysis dialog (for further details, see chapter "Region-Of-Interest Analysis Tool"). In the snapshot below, the Brodman are 41 VOI is now shown in filled-color mode.
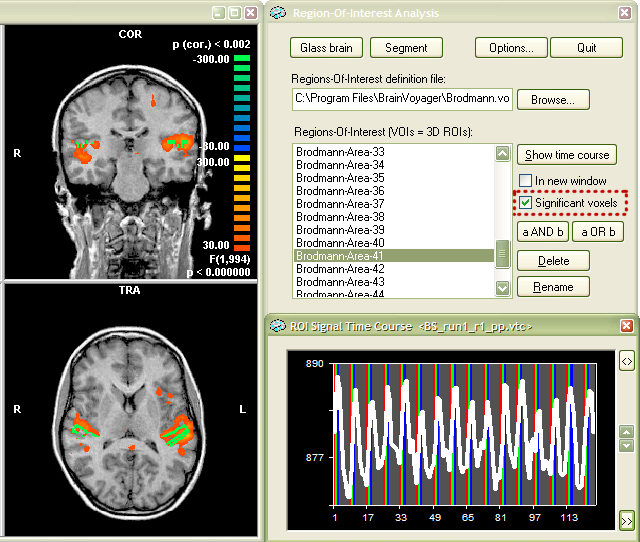
In the next snapshot, a statistical map (VMP) from an experiment with auditory stimulation has been superimposed on the VMR data set (predictor "Subject BS: Auditory stimulation" of "ClockTaskTwoSubjects.glm"). The Brodman area 41 VOI has been selected as before. In addition the Significant voxels option has been checked (see red rectangle below), which restricts VOIs to "activated" voxels. After clicking the Show time course button, you will see that the VOI is now "masked" by the supra-threshold voxels of the overlayed VMP. A comparison with the VOI in the snapshot above reveals that the Brodmann 41 VOI voxels in the right hemisphere do not overlap as nicely with the activated voxels as the Brodmann area 41 VOI voxels in the left hemisphere. The ROI Signal Time Course window now shows the averaged time course of the "activated" voxels within the Brodman area 41 VOI.