An important way to analyze fMRI experiments is the investigation of time courses from brain areas, which were "mapped" in preceding experiments (e.g., O'Craven & Kanwisher, 2000, J Cogn Neurosci, 12, 1013-1023): For each subject, several brain areas (i.e. V5, FFA) are determined once with a simple, standardized stimulation protocol. In subsequent main experiments, the time courses of the premapped ROIs (ROI = region-of-interest) are statistically analyzed. This approach provides two main advantages over a normal whole-volume mapping approach, increased statistical power and spatial correspondency across subjects. The ROI-based analysis approach is statistically powerful because only a small number of a priori specified ROIs/voxels are analyzed. In addition, this approach provides homologue functional areas across subjects, which allows a statistical analysis across subjects without spatial uncertainties. A disadvantage of this approach is that the determination of homologue functional areas is somewhat subjective and might work only for a limited number of brain regions. Another disadvantage is that this approach downplays the role of other coactivated areas by narrowly focusing on the preselected ones.
BrainVoyager allows to determine ROIs based on functional analysis (VMPs)
as well as through direct anatomical specification (VMRs). The ROIs are
saved as a set of voxels and are also called "VOIs" (VOI = volume-of-interest). One or more defined VOIs
are saved in a .VOI file. BrainVoyager's ROI Analysis Tool uses these
.VOI files to access and visualize the VOIs and allows to retrieve the
associated VOI time course from any functional experiment (VTC files).
Depending on taste, you may want to store in one VOI file only the determined
brain areas for one subject ("single-subject VOI") or for all
subjects ("multi-subject VOI").
In the following, it is first described how VOIs are defined based on a
statistical map and how VOIs can be applied using the Regions-Of-Interest
Analysis dialog. It is then described how a VOI can be defined
based on anatomical specification.
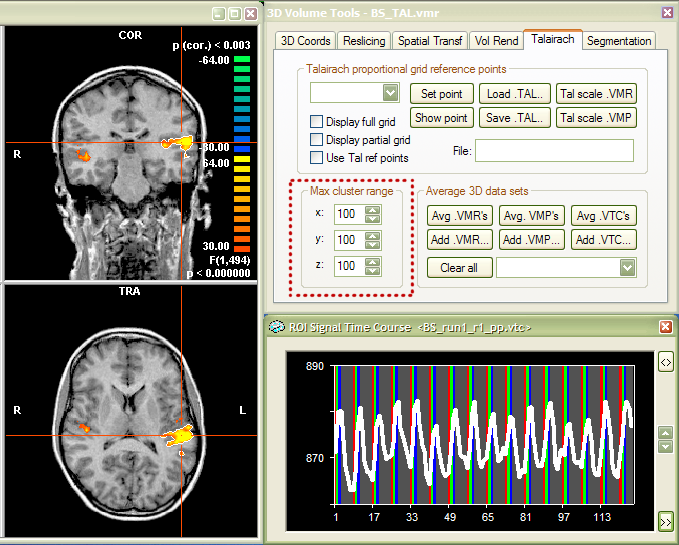
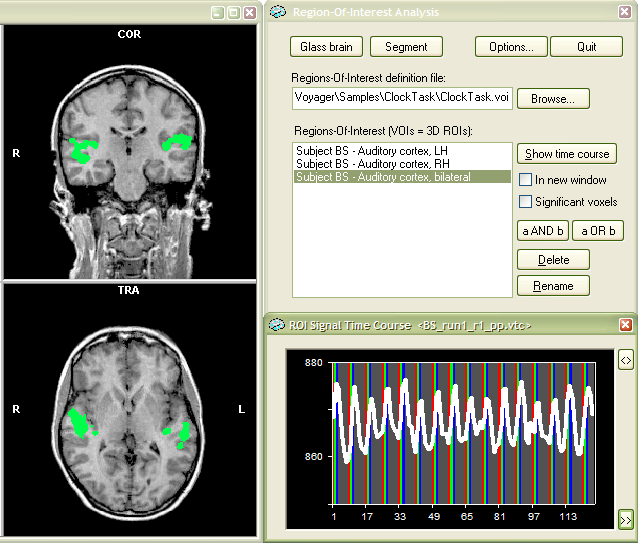
Determination of VOIs from functional clusters. To specify a VOI based on a 3D functional analysis, run any statistical test (i.e. linear correlation, GLM), which will result in a VMP (volume map) data structure. You may also load a VMP file directly or you may load a GLM file and specify a contrast. Any procedure which leads to a VMP data structure can be used for defining VOIs. In the example used here, the GLM file "ClockTaskTwoSubjects.glm" has been loaded from the "ClockTask" sample folder after invoking the Overlay Contrasts and Contribution Maps dialog. From the six listed predictors, only the first one, "Subject BS: Auditory stimulation", has been selected. The default threshold (F = 16) has been changed to F = 30 resulting in the VMP shown in the snapshot below.
The snapshot shows the right half of the VMR window (TRA and COR views,
left part), the 3D Volume Tools
dialg (right, upper part) and a ROI Signal
Time Course window with the time course of a selected region-of-interest
(right, lower part). The time course has been obtained by right-clicking
in the "active" region in the Heschl gyrus of the left hemisphere.
This is the standard way to select functional clusters (activated regions).
The right-mouse click launches a region-growing process, which "spreads"
from the selected voxel to suprathreshold neighboring voxels and stops
at the boundaries of the functional cluster. This process, thus, finds
all connected "significant" voxels. The region-growing process
is, however, not only stopped at the borders of a functional cluster but
is also limited by a specified spatial extent around the selected voxel.
This range can be specified separately for the three dimensions in the
Max cluster range field in the
Talairach tab of the 3D
Volume Tools dialog (see red rectangle in snapshot). The default
range value is "10", which allows to "sample" subclusters
within larger clusters. Since we wish here to select a "complete"
functional cluster, the three range values have been changed to "100"
voxels prior to clicking in the target region.
In the next step, we now define the selected functional cluster as a volume-of-interest
(VOI). The respective button to do this is located in the Options
dialog of the ROI Signal Time Course
window. To get there, we must first "expand" the time course
window by clicking its >>
button in the right lower corner. In the expanded lower section of the
window, click the Options... button,
which will invoke the Options
dialog.
The ROI Time Course Options dialog shows in the VOI infos field information about the selected functional cluster (see upper red rectangle in dialog snapshot above). The NrOfVoxels: value reflects the size of the VOI, which normally corresponds also to the volume in cubic (Talairach) millimeter. The X:, Y: and Z: values show the center of gravity of the functional cluster in Talairach coordinates. The button to define the VOI is located within the Region-of-interest field (highlighted with the lower red rectangle). Click the Define ROI... button, which invokes the Define VOI dialog.
This dialog has two main text entry fields, the Name for VOI: and Add to file: text boxes. Enter a value for the selected functional cluster in the Name for VOI: text field. For our example, the name "Subject BS - Auditory cortex, LH" has been entered. The Add to file: text box is normally filled with the name of the last used VOI file. The specified region-of-interest (the VOI name and the coordinates of the voxels defining it) will be added to the file entered in the Add to file: field. If you have several VOI files, you can also select a particular one directly or more conveniently browse to one after clicking the Select VOI file... button. In our example we enter the file name "ClockTask.voi" (full name: C:\Program Files\BrainVoyager\Samples\ClockTask\ClockTask.voi"). If you enter just the file name without the path, the current directory will be used to define the full file name. Click the OK button to add the VOI to the specified file.
Using VOIs. The defined VOIs are accessed using the Region-Of-Interest Analysis dialog. To be able to invoke this dialog, a VMR data set has to be loaded. If you have several projects loaded in the workspace, click the title bar of the VMR data set you want to work with. For our example, we close and reload the same VMR data set. Invoke the Region-Of-Interest Analysis dialog by clicking the Region-Of-Interest analysis.. item in the Analysis menu. A fast alternative to get the dialog is to press the "R" key.
The dialog shows in the Regions-Of-Interest definition file text box the name "..\ClockTask.voi", which is the VOI file name entered in the previous section. The dialog shows always the most recently used VOI file name. If you want to switch to another VOI file, you can select it using the Browse... button next to the text box. The Regions-Of-Interest (VOIs = 3D ROIs): list box shows the name of the VOI we have defined in the previous step, "Subject BS - Auditory cortex, LH". Select the VOI with a left mouse button click. The Time course (VTC) files: list box has one entry, namely the VTC file "BS_run1_r1_pp.vtc", which was linked to the VMR when the VOI was defined. You can add other VTC files by using the Add... button (see below). You can also delete VTC files from that list by selecting a file name and then click the Delete button. Select the listed VTC file with a left mouse button click. To visualize the VOI and to show the associated time course from the selected VTC file, click the Show time course button.
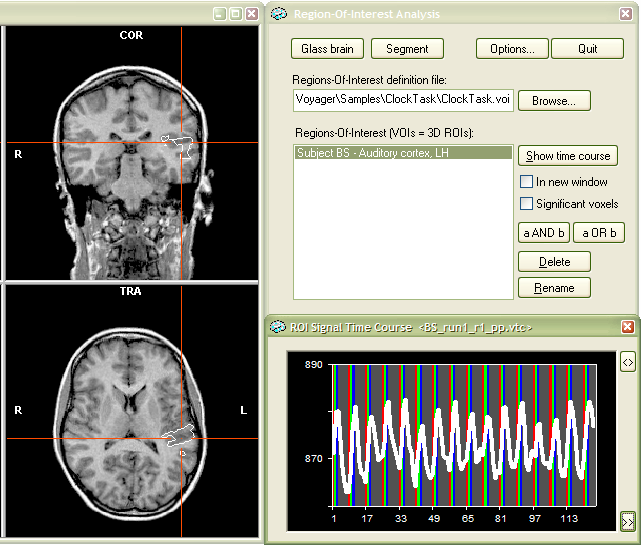
The snapshot above shows the selected VOI in the 3D VMR View window. The white lines show the outline (border) of the cluster. The associated time course for that VOI for the selected VTC fiel is shown in the right lower part and matches the time course we have seen when the VOI was defined.
NOTE: The Region-Of-Interest Analysis dialog is a "modal" dialog that means that the graphical user interface is blocked until you leave the dialog by clicking the Quit button. If you want, for example, to navigate in the VMR window, you must first quit the dialog. You can quickly reenter the dialog by pressing the "R" button. (BrainVoyager QX uses a "modeless" dialog which does not block the graphical user interface).
Besides in outline mode, a VOI can also be shown "filled", i.e. all voxels belonging to a cluster are then set to a certain color value. To change display settings, click the Options... button in the Region-Of-Interest Analysis dialog, which will invoke the ROI Analysis Options dialog as shown next.
The dialog shows the default settings. Deselect the Show
Outline of ROIs option and check the Enable
ROI colors option. Click the OK
button. Click the Show time course
button in the Region-Of-Interest Analysis
dialog. You will now see the selected VOI in filled color mode.
The main goal of the VOIs is to look at associated time courses from other
VTC files. As an example, we will now add a VTC file from another subject
who has participated in the same experiment and inspect the time course
within the VOI which we have defined for subject "BS". Click
the Add... button and select the
file "ML_run1_r1_pp.vtc" located in the "ClockTask"
sample folder. The file is added to the Time
course (VTC) files: list box and automatically selected as the
current one. After clicking the Show
time course button, you will see a display similar to the snapshot
shown below.
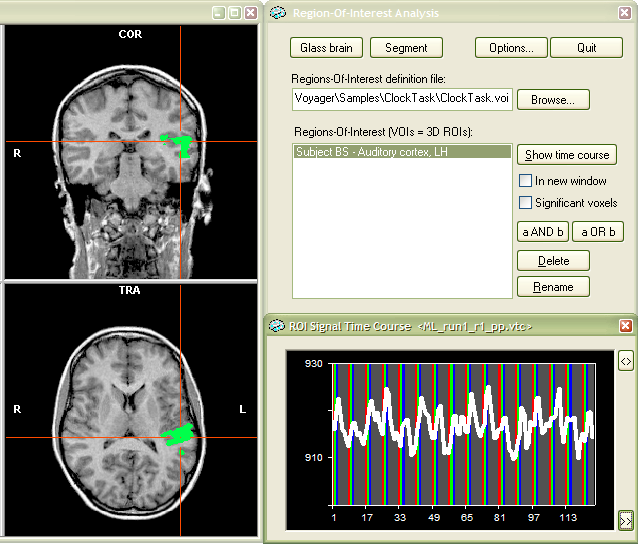
As depicted in the title bar of the ROI
Signal Time Course window, the time course shown is now from the
selected VTC file "ML_run1_r1_pp.vtc". In the outlined manner,
you can use any VOI to select the time course at that region from any
VTC file. As an interesting additional option, you can run a ROI
GLM analysis to obtain detailed statistical information for the selected
VOI.
Additional options. You may
change the name of a VOI by clicking the Rename
button. You may delete a VOI from the list box by selecting it and then
clicking the Delete button.
If you display sequentially several time courses, you can chose whether
you show each new time course in the same window or each in a new window.
As default, one window appears and its content is replaced when showing
the next VOI time course. If you check the In
new window option, each new time course will be shown in a separate
window. It is also possible to select multiple VOIs for display. Hold
down the CTRL key and click on all VOIs you want to display. If you want
to select a contiguous range of VOIs, select the first one, hold down
the SHIFT key and then click the last one in the range. Note that in case
you have selected multiple VOIs, each ones associated time course is shown
in a separate window after clicking the Show
time course button, irrespective of the state of the In
new window option.
An interesting feature can be enabled by checking the Significant
voxels option. This option allows to show the time course for those
voxels of a VOI only, which are above the current threshold of an overlayed
statistical map (VMP). Note that this option has only an effect if a VMP
is loaded. This possibility is, for example, relevant in the context of
retinotopic mapping experiments. Here you might have mapped areas V1,
V2, V3 etc. and then present a certain stimulus in a subsequent experiment
activating a subpart of V1 and the other mapped areas. If you now select
the V1 VOI, the time course averaged over the whole area would be shown
in default mode. If you, however, check the Significant
voxels option, only the time course of the activated subpart of
V1 will be shown. An example of this feature is presented at the end of
the chapter "Talairach brain
atlas".
VOI intersections and unions. Another interesting possibility is to define new VOIs based on the intersection or union of a selected set of "source" VOIs. Simply select a set of source VOIs in the list box by holding down the CTRL key, then click the a AND b or a OR b button. Although these two buttons refer only to two VOIs (a, b), they operate also for 3 and more selected VOIs. The union operation (a OR b button) computes a new VOI containing simply all voxels of all selected VOIs. If the selected VOIs overlap, the respective voxels are included only once in the final VOI. The intersection operation (a AND b button) detects the set of voxels contained in all selected VOIs. These voxels then define the new VOI. Note that if the intersection set is empty, the program informs you about this situation and does not add a new VOI. After a successful execution of a union or intersection operation, the program asks you for the name of the newly defined VOI. The following example describes how the left and right auditory cortex has been combined into a new VOI by using the union operation. First the active region in the auditory cortex of the right hemisphere has been selected as described above and then added to the same VOI file ("ClockTask.voi"). The Region-Of-Interest Analysis tool now shows two VOIs:
Both VOIs have been selected by CTRL-clicking them. To create the new VOI as the union of the two source VOIs, click the a OR b button (see red rectangle above). The program presents a New VOI Name dialog asking for the name of the union VOI. Enter, for example, "Subject BS - Auditory cortex, bilateral" and click the OK button.
The new VOI finally appears in the Regions-Of-Interest list box (see snaphsot below) and can be selected and used as usual.
VOI segmentation and surface reconstruction options. VOIs are normally shown overlayed on a VMR data set. For certain applications it is desirable to have a standard VMR representation of VOIs. One such application is the surface reconstruction of functional clusters. The Region-Of-Interest Analysis dialog provides two buttons, Segment and Glass brain, to provide this functionality. The features described here are also used as part of the glass brain display option. To use the "segmentation" or "glass brain" feature, you must first select one or more VOIs in the Regions-Of-Interest list box. In our example, select the VOI "Subject BS - Auditory cortex, LH" and then press the Segment button.
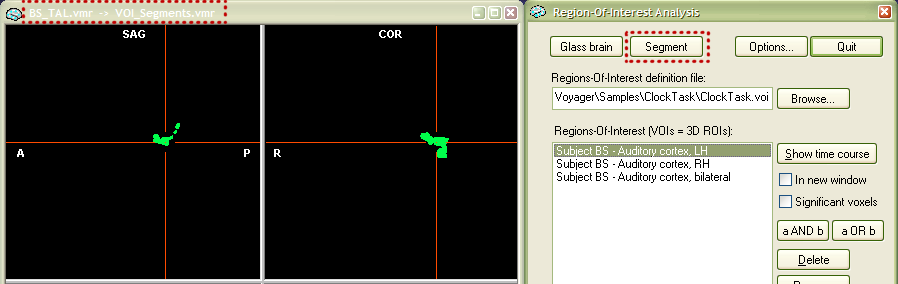
The "Segment" feature creates a new VMR data set with the name "VOI_Segments.vmr" containing the selected VOI(s) as color-coded voxels. The created data set is available in the VMR viewing window as a secondary data set. The title bar now shows the primary data set ("BS_TAL.vmr") and the secondary data set ("VOI_Segments.vmr") together with an arrow indicating which data set is currently shown in the SAG, COR and TRA views. You can toggle between the two data sets using the "F8" key (for details, see section "Two VMR data sets" in chapter "Keyboard and Mouse Functions"). You can also save the secondary VMR by using the File -> Save secondary VMR... menu. With this VMR file, it is now possible to perform any standard operation. One interesting operation is surface reconstruction. If you click the Clear for rec. button in the Segmentation tab of the 3D Volume Tools dialog, the VOI gets prepared for a boundary reconstruction process. If you then switch to the surface module and click the Reconstruct button in the Create Mesh dialog, a polygon mesh representation of the VOI is created and displayed in the surface module window. The snapshot below shows the segmented VOI after the "clear for reconstruction" process on the left side and the surface representation after the "boundary reconstruction" process on the right side.
The outlined steps are performed automatically when using the "glass brain" option. Select the two VOIs "Subject BS - Auditory cortex, LH" and "Subject BS - Auditory cortex, RH" and then click the Glass brain button as indicated in the snapshot below.
The "glass brain" tool first works like the "segmentation" tool creating a VMR with the selected VOIs. It then switches to the surface module, reconstruct the boundaries of the VOIs and smoothes the resulting polygon mesh representations slightly. Note that these steps are performed for each VOI successively which allows to assign a different color to them. The program finally enables a surface representation of the (reduced) Talairach grid. This grid can be turned on or off within the 3D Axes Options dialog, which you can invoke using the Meshes -> Rendering options -> Axes and Tal grid... menu. You can also easily change the colors of each VOI by using the "surface flood fill" option. This feature is activated by clicking the Fill mode icon (see red rectangle in the snapshot below). After turning this feature on, click with the left mouse on one of the VOI clusters.
The cluster will change its color to the one currently selected in the Region Deletion and Coloring dialog. You can invoke this dialog using the Meshes -> Floodfill options... menu. Change the current color using the Fill color index: spin box (see red rectangle below). The RGB values of the selected color can be changed in the three text boxes R, G and B of the Fill color basic/convex: field. Click the OK button to close the dialog. Now the selected color is used when using the surface flood fill tool.
NOTE: Do not forget to turn the surface flood fill tool off by clicking the Fill mode icon again after completion of coloring the VOIs.
NOTE: The set of reconstructed VOIs is saved as one surface in the file "Clusters.srf" within the current directory allowing you to use this file in the future. To prevent overriding the file with new "surface VOIs", you might want to rename the file within Explorer or simply save it under a different name in BrainVoyager.
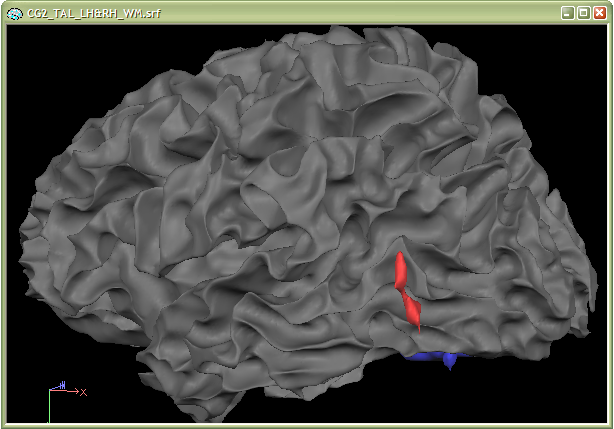
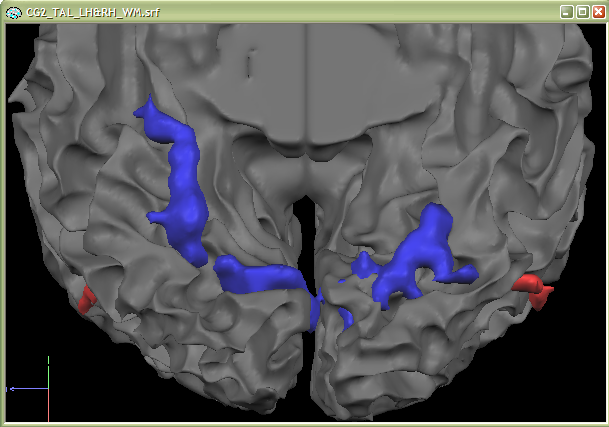
Reconstructed VOIs ("surface VOIs") can be visualized in combination with other surfaces. One example is the glass brain view showing reconstructed VOIs simultaneously with a surface representing the contours of the Talairach brain. Another important application is the combined visualization of cortical surfaces of an individual brain together with surface VOIs from statistical results of the same subject. This is an alternative to the standard "surface painting" visualization used with surface maps. This kind of combined visualization provides a useful additional visualization with the advantage that it does not suffer from functional sampling problems which might happen with surface maps in case that the cortex is not reconstructed correctly in some brain regions. The two snapshots below show such a combined visualization. The data used is from the "Objects" example. The first snapshot (lateral view) shows that the red functional cluster (hMT+/LO) fits nicely to the "grooves" in the cortex.
The second snapshot also shows that the functional clusters fit perfectly well into the sulci of the ventral visual cortex. This kind of visualization is, thus, also an important diagnostic tool for evaluating the quality of the functional-anatomical coregistration.
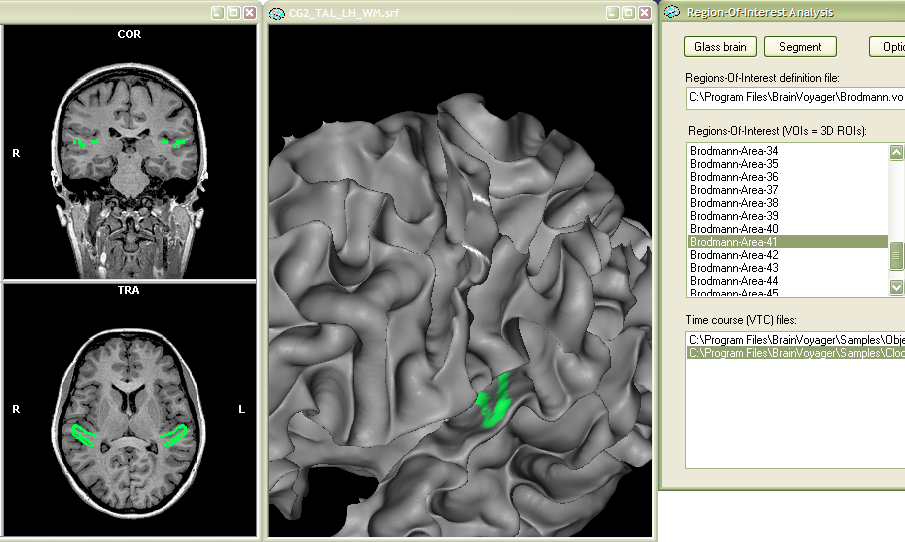
Visualization of VOIs on surfaces. VOIs are visualized as default in VMR data sets. In the previous section it was explained how VOIs can be also represented and visualized as polygon meshes in the surface module. Another possibility is to visualize VOIs on a surface. The latter approach is similar to the standard use of surface maps visualizing statistically significant regions with a separate color range on the surface. It is possible to color VOIs on the surface with the ROI Analysis tool. There is no extra button to activate this feature, it simply works automatically as soon as a surface mesh is available in the surface module. The surface has to be, of course, "touch" the voxels in the corresponding VMR data set, otherwise the VOI will not be visible. In the following example, the "Brodman area 41" VOI has ben selected (see Talairach brain atlas) and visualized using the Show time course button. Besides a VMR data set ("CG2_TAL.vmr"), a reconstructed cortical surface ("CG2_TAL_LH_WM.vmr") has been loaded before visualizing the VOI. As you can see in the snapshot below, the Brodmann 41 VOI is now shown both within the VMR data set as well as on the cortical surface mesh. The VOI on the surface is colored with surface fill color 1, which has been changed to a green shade (R =0, G = 255, B = 75) in the Region Deletion and Coloring Options dialog (see explanations in the previous section to change "surface fill colors").
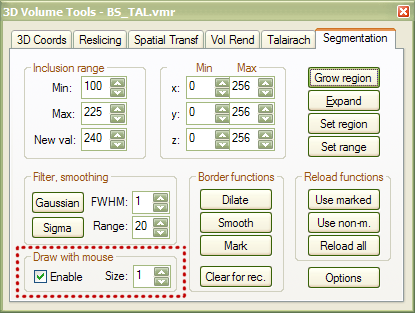
Determination of VOIs based on anatomical specification. At the beginning of this chapter, it was explained how a VOI can be specified from functionally defined (statistical) clusters. The ROI analysis tool also allows to create VOIs based on anatomical specification: Any marked set of voxels in a VMR data set can be transformed to a VOI data structure. One way to mark voxels in a VMR data set is to use the "mouse drawing tool", which is available in the Segmentation tab of the 3D Volume Tools dialog (see red rectangle below). To activate mouse drawing, check the Enable option in the Draw with mouse field.
NOTE: Although the drawing tool is used in this section, any method producing a set of voxels with the same color (i.e. region growing, projections from a surface) can be used to define a VOI.
After activating the "mouse drawing tool", any click in the
associated VMR data set now sets the color of the selected voxel to the
color value specified in the New val:
text box of the Inclusion range
field. The value in the New val:
text box should normally be in the range of 226 - 245. The colors of these
indices correspond to the 20 colors shown in the Overlay
Look-Up-Table dialog (Options
-> Change overlay LUT... menu). The color indices shown in this
dialog in the Color column correspond
to the New val: value after subtracting
"225". The default color index "240" corresponds,
for example, to the color 240 - 225 = 15, which is a blue-green color
shade in the default look-up-table.
Since mouse clicking (including moving the mouse while holding down the
left mouse button) is now used for "drawing", it can no longer
be used for navigating in the VMR data set. To navigate with the mouse,
you must turn off the drawing tool by unchecking the Enable
button in the Draw with mouse
field. Alternatively, you can use the cursor
key buttons to navigate in the VMR and use the mouse for drawing.
The extent of the drawing tool can be specified in the Size:
text box in the Draw with mouse
field. This value determines the size of the border of a square, i.e.
a value of "3" would color a 3 x 3 patch. The specified size
of the drawing tool is used only within the slice plane clicked. If, for
example, a click is performed in the COR view, the specified size (i.e.
2 x 2) is applied within that plane but is restricted to a depth of one
voxel. You can change this behavior in the Segmentation
Options dialog by unchecking the In-plane
option in the Mouse drawing field.
If you draw primarily in one plane, you might want to enlarge the respective
view by using the CTRL-T button combination.
In the following example, the left hand motor cortex is marked approximately
in a VMR data set ("BS_TAL.vmr") and then defined as a VOI.
On the snapshot below, you see the beginning of the drawing in the "hand
knob" region, which is a landmark of the cortical motor representation
of the hand.
The next snapshot shows a COR view at the end of drawing (left side). The next step is to create a VOI for the marked region. Click the Options button in the Segmentation tab of the 3D Volume Tools dialog to invoke the Segmentation Options dialog.
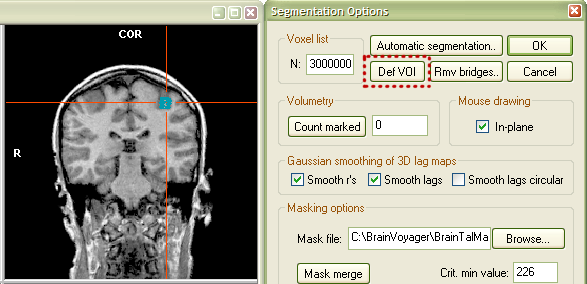
To define the VOI, click the Def VOI button (see red rectangle). This will invoke the Define VOI dialog. From this step on, the procedure is the same as that described in the "Determination of VOIs from functional clusters" section above. Enter a name for the new VOI (for example "Subject BS - hand knob, LH") and select a .VOI file ("ClockTask.voi") to which the defined VOI should be added. Now click the OK button.

The VOI is now defined and added to the specified .VOI file. You may
now turn off mouse drawing. You may also want to use the Reload
all button in the Segmentation
tab to "undo" the mouse drawing or simply close and reload the
VMR file.
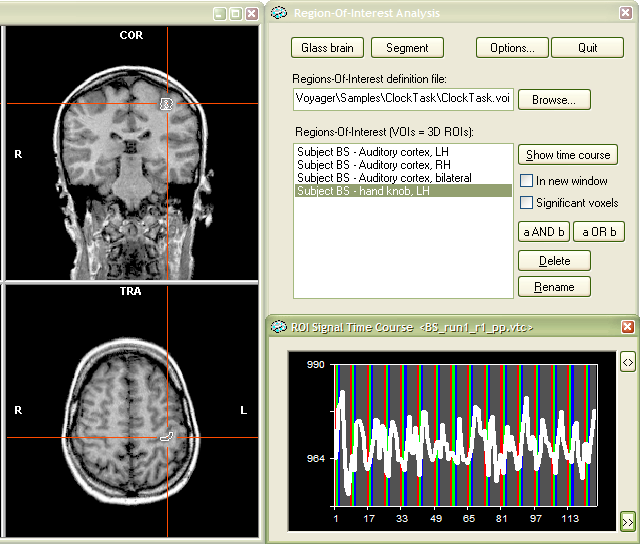
To use the new VOI, invoke the Region-Of-Interest
Analysis dialog. You will now see the VOI "Subject BS - hand
knob, LH" in the Regions-Of-Interest
list box. Select the VOI as well as a VTC file. The VTC file used in our
example ("BS_run1_r1_pp.vtc") involves button presses with the
right hand. Click the Show time course
button. You see now the VOI in the VMR data set as well as the associated
time course which shows indeed event-related motor activity.